Are you planning to have a coffee break with an IT professional nowadays? Get ready first! The jargon in the tech/fintech/industrial sectors today is so much crowded with acronyms and buzzwords that you will be struggling to follow the conversation unless you know at least some of these codes. OEE is just such an acronym.
Wikipedia of course is here to help us:
“Overall Equipment Effectiveness (OEE) is a measure of how well a manufacturing operation is utilized (facilities, time, and materials) compared to its full potential during the periods when it is scheduled to run. It identifies the percentage of manufacturing time is truly productive. An OEE of 100% means that only good parts are produced (100% quality), at the maximum speed (100% performance), and without interruption (100% availability).”
OEE is not a recent “invention”. It was already discussed in the literature of the late 1980s, although it was then more commonly referred to as TPM (Total Productive Maintenance).
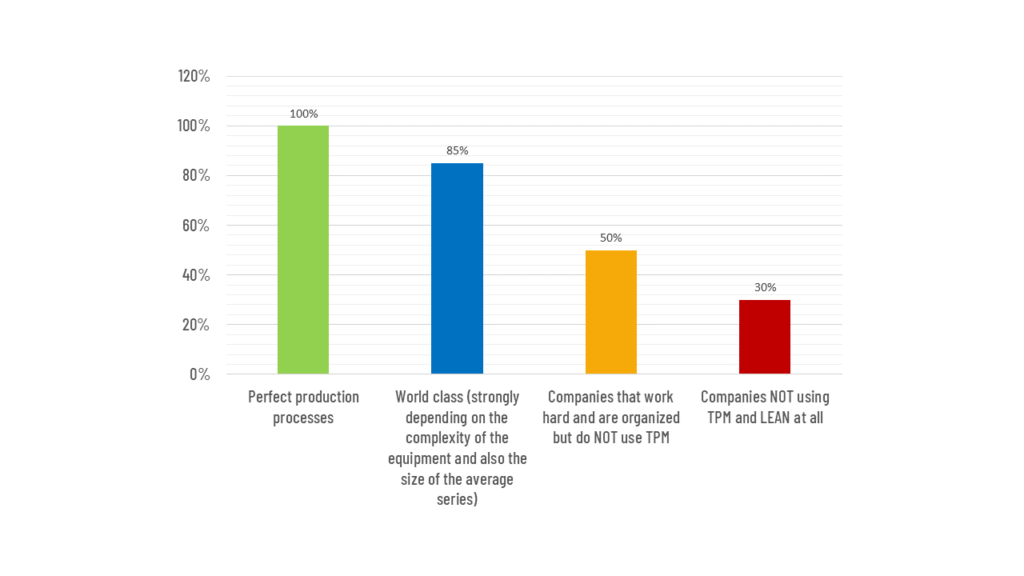
Why is OEE so interesting for a manufacturing company? Nowadays, we monitor a lot of KPIs (Key Performance Indicators – another acronym…) to survey a production sub-process or the entire production. For example, we would like to see objective, numerical data on the temperature of a furnace or the torque delivered by a motor, so that experts can intervene at the right point if necessary. These are mostly specific values, their meaning and usefulness may vary from factory to factory.
In our previous post, we’ve already pointed out: the flagship of industrial revolution has always been efficiency. Innovators have always chased with various technological inventions. This is no different now, but finding bottlenecks between the phases of sophisticated (and in most cases automated) manufacturing processes is not always trivial. For this reason, it is worth introducing some simplification – and OEE can help.
The theory of OEE
The OEE is a single numerical value that shows “how well we are producing” or “whether we are as good as we imagined”.
Arguments and calculation of OEE
OEE is the result of three components.

Each indicator is (normally) between 1-100%, the product of which should also result in a number in the same range.
The performance indicator shows whether the required quantity was produced in the planned cycle time per product, while the machine was continuously producing.
The availability indicator shows how much of the planned time our machine was able to spend in “production” mode, and what percentage of that time was lost due to some unplanned downtime.
And the quality indicator shows the ratio of good to rejects, which correlates with the quantity of saleable products that actually create value.
Based on our experience, we can say that of these, insufficient availability hurts firms the most and quality problems the least.
This is where we can draw the theoretical boundary of a brief description of OEE. Now let’s see what happens in reality!
OEE and reality
Although OEE is intended to standardise, we see that “everyone uses it differently”. The main reason for this is that OEE is supposed to measure the efficiency of a machine or piece of equipment, but in most cases, human resources are involved in the production process. It is therefore very easy to confuse what is actually worth measuring. To illustrate this with one or two examples:
- We have purchased a CNC machine that is supposed to be able to produce 7/24, but we only have enough operators to service one shift. In this case, is the planned availability 24 hours or 8 hours per day?
- How do we account for the breaks between shifts when there is no operator at the machine (even though it could produce)?
- There is no fault with the machine, the required quantity has been produced in the expected cycle time, but suddenly the raw material runs out. Whose efficiency is affected?
There is no right or wrong answer to the above cases/questions, but it is extremely important to check the measurement results against this!
To unravel the mystery of OEE, we also offer various functionalities in WaMeWo (“Production display”, “Production reports”, “Machine status reports”). We have now delivered several projects for our customers that give an accurate picture of the current or past efficiency.
What do you need to measure OEE?
We can get results by aggregating the following input data.
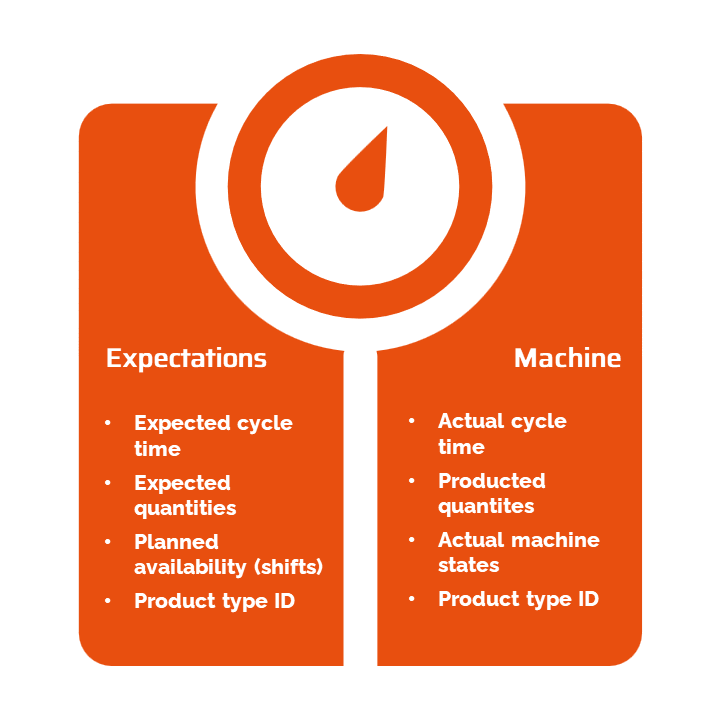
We offer our own services for entering standard values – for example, for entering shift schedules or expected quantities. But in most cases we develop custom interfaces to retrieve the necessary data from the customer’s existing MES/ERP software.
In all cases, the actual equipment data is obtained fully automatically from the controllers’ memory via our own data loggers, so no manual interaction is required. Based on our experience, this information has already been implemented in the controllers of older production machines (part numbers, cycle times, machine states).
The “Production Indicator” module of our system is based on the three components described above, which calculate metrics from data collected in real time.
Experience has shown that real-time tracking alone has a demonstrable impact on production efficiency. For the majority of our clients, the fact of implementing the system, i.e. making the efficiency indicators public, can lead to average OEE increases of at least 5% and sometimes 10-15%.
The calculation method is standardised, but it depends on the production machine or the cell controller and data acquisition unit, in which form the data required is available.
The OEE module performs the following functions:
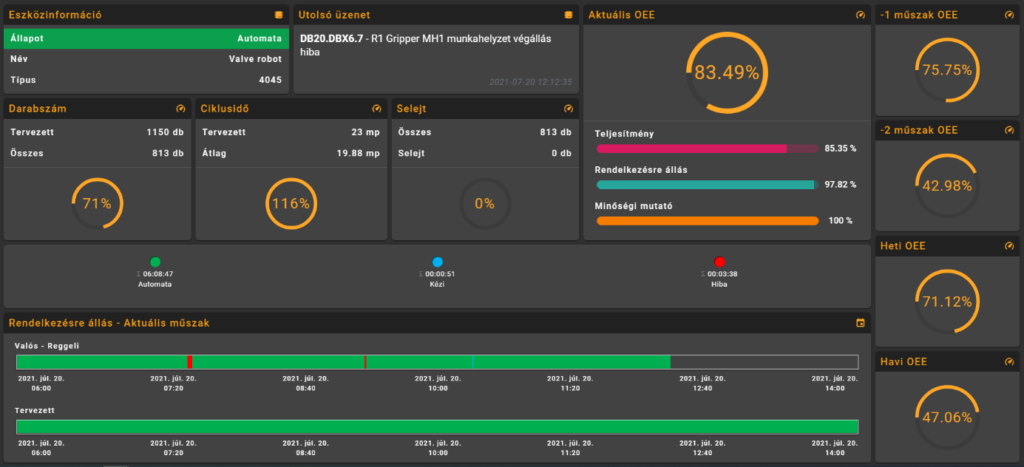
- Display of current machine status, machine name and type produced
- Real-time display of last fault and warning message, with time stamp
- Real-time display of current shift OEE values
- Weekly, monthly and previous two shift OEE values
- Real-time display of availability time, scrap count, average cycle time
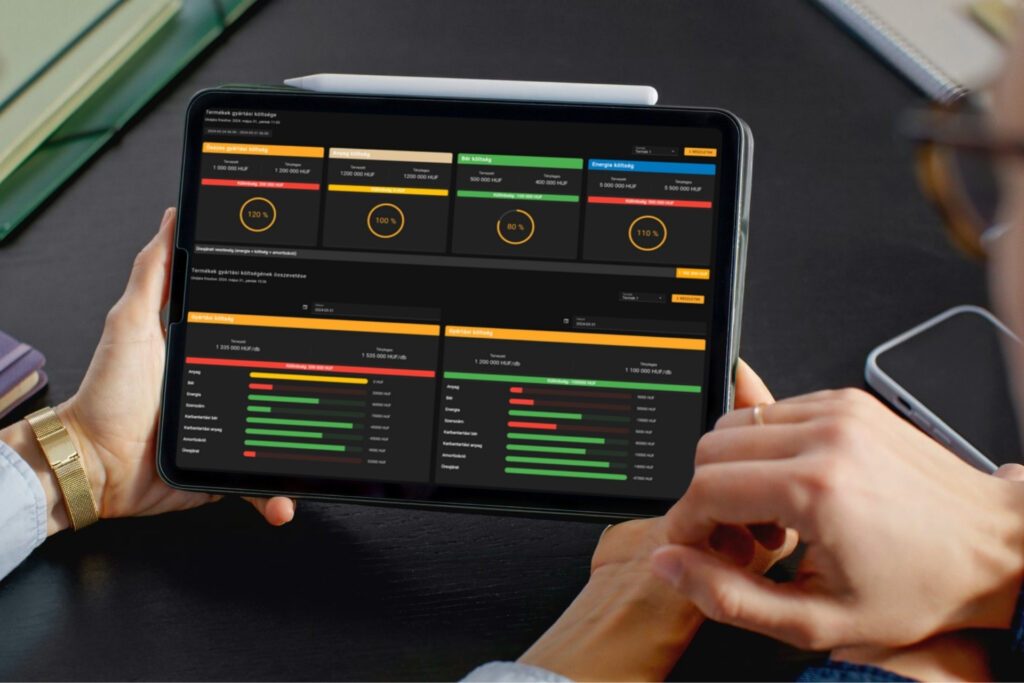
The “Production Display” screen always shows the currently running shift data, which is automatically updated every second, giving you an instant, accurate picture of the current shift KPIs, even visualised on a larger display. The availability timeline always shows the machine states of the shift, such as downtime (in red) or production (in green). This timeline has an interactive function, clicking on the downtime in the bar will show the faults and downtimes that occurred during that period.
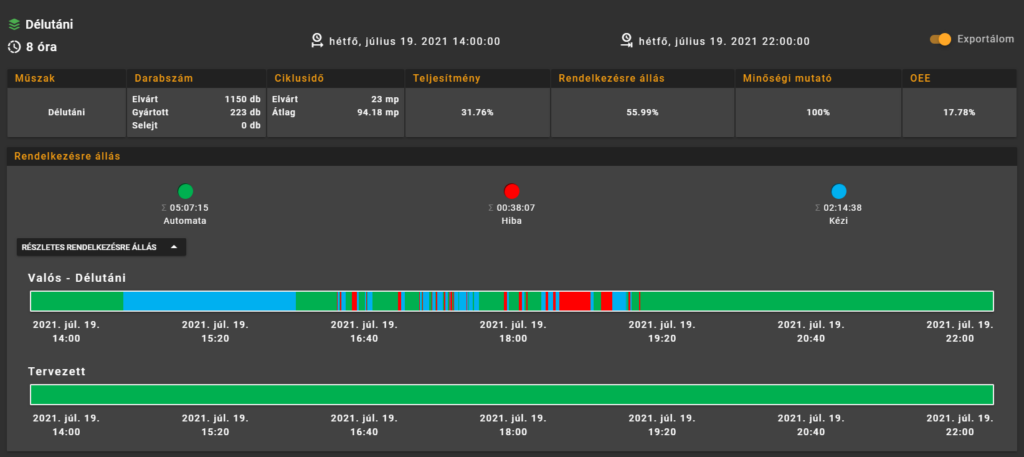
Detailed reports of the OEE can be viewed hystorically in the “Production reports” and “Machine statuses” menus, or exported in Excel file format based on predefined queries for further analysis.
In addition to the standard OEE measurement, we also offer the following extras to meet your specific needs:
- OEE measurement per product type, OEE summary per machine group, OEE summary per plant section
- depending on the equipment design, several machine states can be automatically detected (e.g. manual operation, maintenance, etc.)
- the actual calculation method and formula can be flexibly customised according to customer needs

Take aways
Factories that are already measuring the efficiency of their production with some kind of digital IIoT/i4 tool are definitely one step ahead of the rest. However, this alone is not enough to achieve real efficiency gains!
A few tips on how to use OEE measurement data “well”:
- It is not enough to measure OEE, we should also use the results to intervene in the production process and take the necessary actions!
- Don’t fool ourselves by manipulating OEE norms: some factories under plan their capacities due to their known inefficiencies, so that they can produce better KPIs than actual ones “on paper”.
- The calculation method may be specific, but always make sure that you only “tamper” with the OEE in one place (i.e. do not, for example, tamper with both performance and availability by using a faulty machine condition)!
What is this series of articles about?
This series of articles has been compiled by our team in order to provide both technological and business know-how for professionals involved in the digitalisation of the industrial sector. The chapters follow two guiding principles:
- exploring the reasons behind the manufacturing digitisation software technologies used and
- demonstrating their potential for business use.
We trust that our content will provoke constructive professional discourse. We welcome your feedback, opinions or questions on info@indeveyes.com-on or our social media platforms!
- In a previous article in this series, we wrote about Machine stops.
- In our next article, we will talk about Robot diagnostics.
