The fourth industrial revolution is actively underway in our region. Many are already talking about the 5th, but our experience shows that a lot of manufacturers have only successfully integrated the third so far. This topic is also worth analysing, but for now, let’s stick to a theme that has been the common goal of technological innovation in all industrial revolutions so far:
efficiency (enhancement).
Less input, higher profit
Who wouldn’t want to produce more with less and make a higher profit at the end of the day? How to increase efficiency? This is a highly context-dependent question. One thing is for sure: reducing losses in production is a common challenge for production regardless of industry or production technology.
Loss reduction
The first step is to identify the problem: what is loss for us? Where do we start?
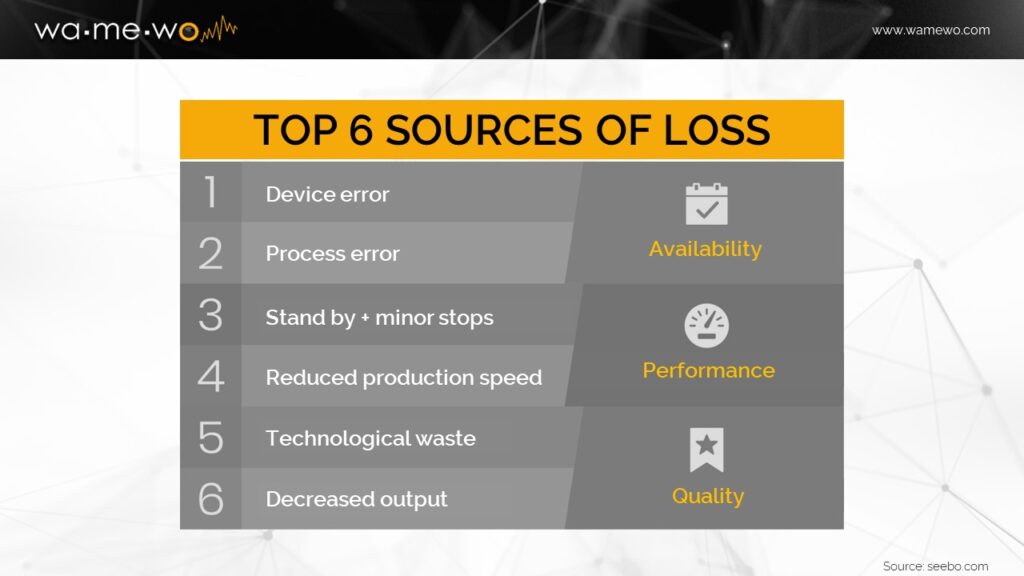
The good news: various statistics are available from around the world on the biggest (known) sources of losses in the manufacturering industry. One such survey was published earlier by seebo.com, which shows that if we identify the types of losses based on the arguments of OEE (we will look at the OEE buzz in more detail in a later chapter), it is clearly the lack of equipment availability that causes the most unnecessary costs. And when is a machine not available? When it is down due to some anomaly. And we have arrived at our topic:
What to do with downtimes?
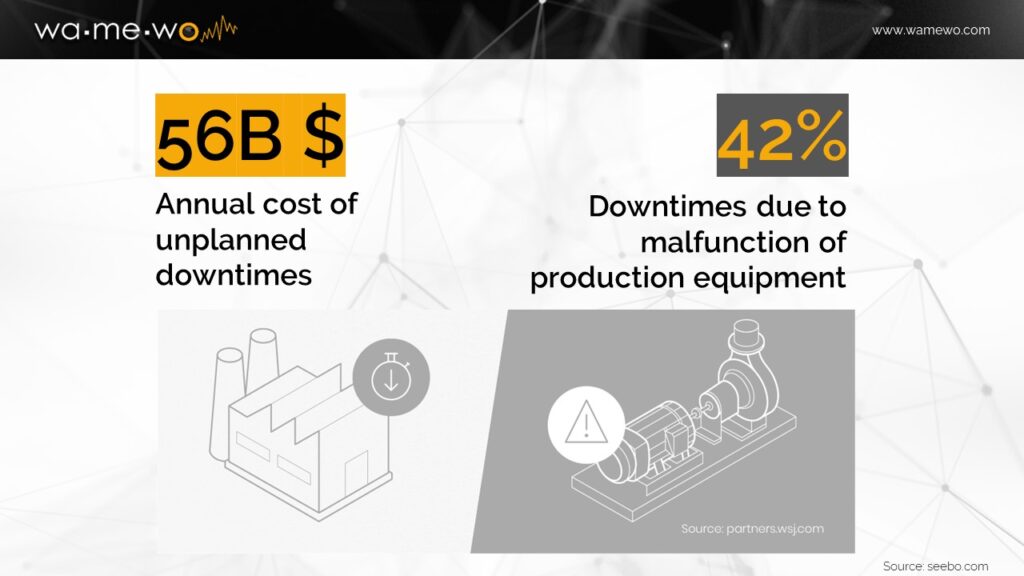
The answer could be very short: abolish. OK, but how? Where do we intervene? What should we do?
If we go online to the various industry 4.0, digitalisation and IoT software solution providers, almost all of them will promise systems that answer the questions of loss reduction. The most daring ones also offer AI/ML-based anomaly prediction, which may be able to predict when a machine is likely to stop. With these predictions in mind you can then schedule the necessary maintenance actions.
But how can an algorithm “see into the future”? The same way human predictions are made: based on past experience. So, if we want such an intelligent tool in our plant, we first need to tell it what has happened in the past (the more and more in detail, the better), so that it can learn from the patterns labelled, and then recognise signs of undesirable future events in the present – well ahead. Let’s be realistic about our possibilities: these algorithms need a lot of “pre-selected” input data.
We need to mark undesirable correlations. The development of algorithms requires specialised knowledge from data scientists. Futhermore, the (continuous) training of models requires large computational capacity.
Nowadays, for a significant proportion of manufacturers, the reasons for machine downtime are still recorded on paper at the end of the shift, which is then typed into an Excel spreadsheet and analysed by another person who then finds that the company has been unable to produce enough for two weeks because the production line has been down too much… Not only has the company been producing a loss for two weeks, but it was also buring environmental resources like paper, and on top of that, it’s been wasting human creativity for monotonous administrative tasks. A lot of losses are incurred before the source of the problem is even identified.
What if we were to say that between paper-based record keeping and futuristic-looking artificial intelligence, we offer an entry point that both addresses the shortcomings of the past and embeds data-driven production management?
WaMeWo‘s built-in “Downtimes” and “Downtimes Reports” functionality helps you do just that. Let’s take a closer look at how it works!
To increase uptime, we need to identify three pieces of information so that they can be analysed in a meaningful way (by humans or machines):
- When and how long downtime occurred,
- what faults collected from the machines could have caused it,
- what explanation is given by the operator/technician for the downtime.
What to do in the event of a machine downtime
#1 Detect an error
First of all, we need to develop a method to detect in a fully automated way the state of the equipment when it’s at a standstill(s). Based on the data collected from the machine controllers, this can usually be determined easily, and a flag can be set up to clearly indicate that production has stopped due to an error.
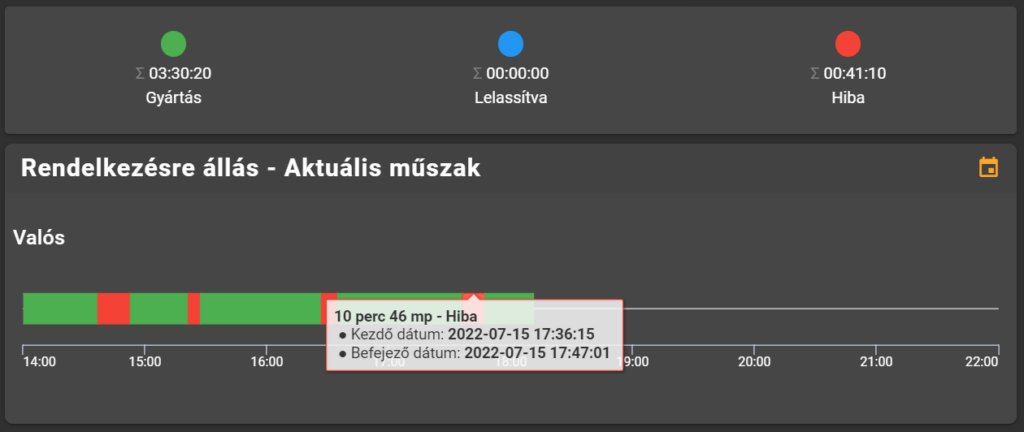
#2 Enter causes for machine downtime
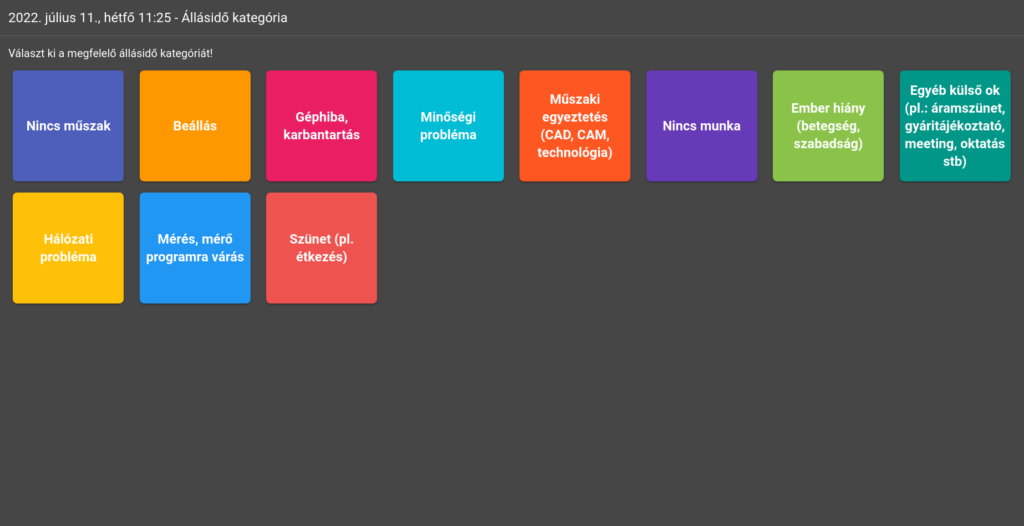
Let’s suppose we already know when and for how long our machine has stopped, but we don’t know yet why. Before we go on, it’s worth defining the minimum length for which the production line has to be idle before we start investigating the case. Of course, we could say we wanted to analyse all downtimes, but for example, in a production process with a 30-minute cycle time, it may not be worth looking at micro-stops of seconds as long as we have longer ones too. Once we have this magic number we want to scale to in the first place, we can specify in WaMeWo the length of a downtime for which it should ask the outside world for a reason as to what caused it. If this case, the operator can, for example, enter the reason from a pre-defined list in an intuitive interface…
… and you can also reach statistics historically.
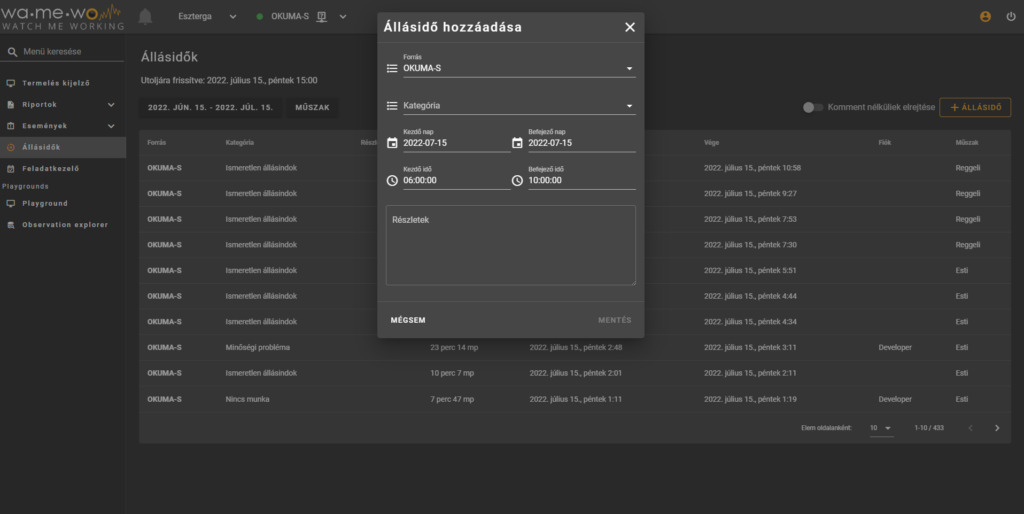
We believe in gathering all information from the machines wherever possible, but there are times when human feedback is still needed. With such tools, we can greatly enhance digitisation (saving paper and Excel), and we will have a much better prepared database for a learning algorithm.
#3 Downtime analysis
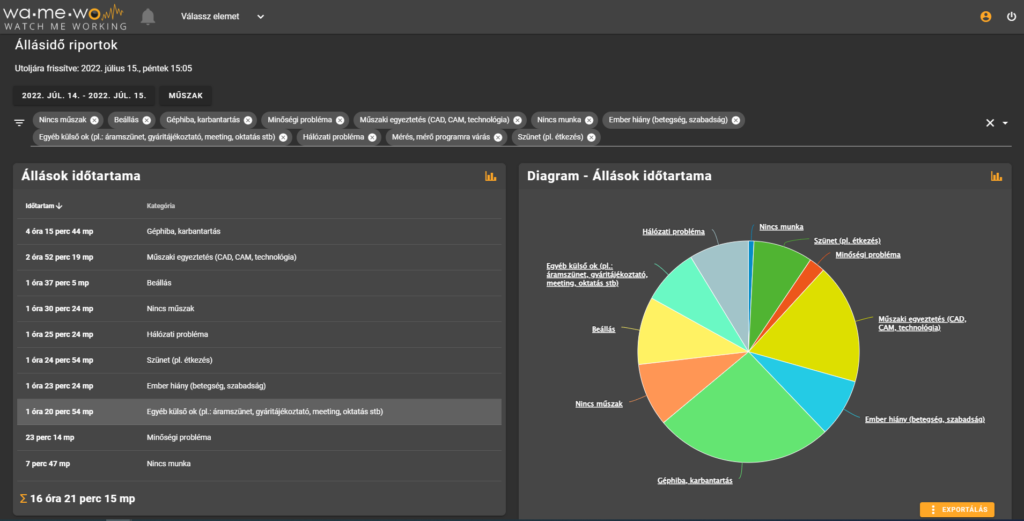
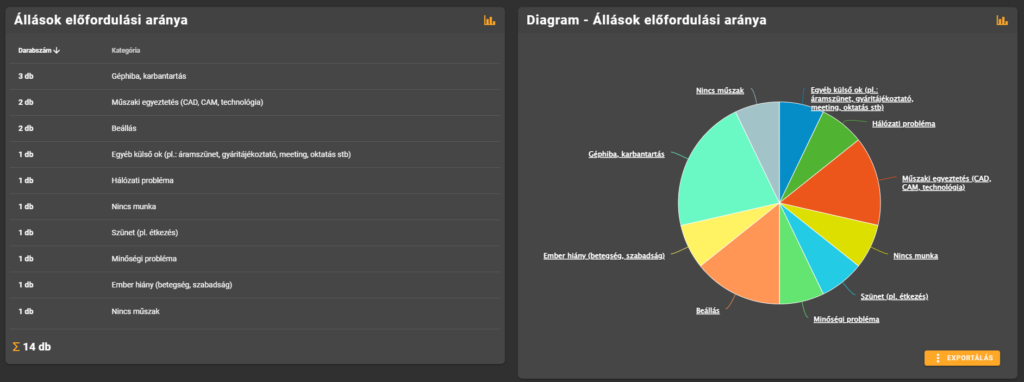
If we were still using Excel to record our data, we would have to create our own statistics to analyse the collected dowtime data – with some kind of preference. The most common preference is of course the one that caused our production to stop the longest or most often.
WaMeWo’s built-in statistics module will give you the answer right away, you just need to click through to the appropriate menu. Here you can investigate the causes by focusing on an entire factory, area or machine, or filter on a specific downtime index.
#4 Linking to machine errors
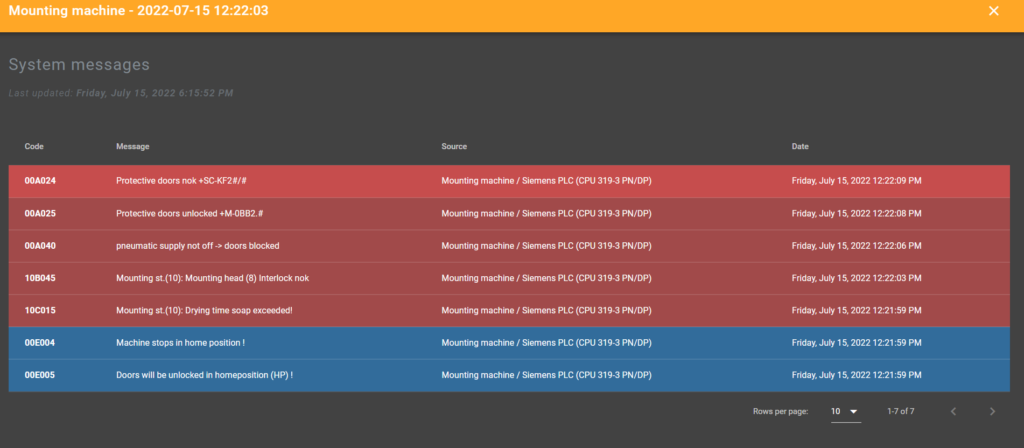
And that’s not all. We won’t let the credibility of machine data to be wasted, so in WaMeWo’s “Downtime” menu, we’ve not only listed downtimes with relevant causes, but also developed a procedure to correlate it with the equipment’s own error messages. If the machine’s own system messages are available from its controller, they are collected (in a separate functionality) and analysed.
This function will list faults from one minute before the detected stop until the end of the stop. There’s a good chance that the list will include the error message that may be linked to the stoppage. A more complex algorithm you might use in the future will thank you for all these data!
Take aways
The above mentioned functionality is the most popular service of industrial digitalisation tools. It won’t spoil you with utopian analytical procedures, but it is most helpful where the shoe is the tightest:
- It makes the shop floor even more paperless,
- It makes it easier to analyse the root causes based on holistic data,
- Thinking ahead, it helps us to “make the foundation” for a future artificial intelligence, which will offer us solutions in a next step.
What is this series of articles about?
This series of articles has been compiled by our team in order to provide both technological and business know-how for professionals involved in the digitalisation of the industrial sector. The chapters follow two guiding principles:
- exploring the reasons behind the manufacturing digitisation software technologies used and
- demonstrating their potential for business use.
We trust that our content will provoke constructive professional discourse. We welcome your feedback, opinions or questions on info@indeveyes.com-on or our social media platforms!
- In a previous article in this series, we wrote about Key criteria for machine data collection .
- In our next article, we will talk about OEE measurements.
